At the heart of the calculation of ratings is a curve which purports to give the probability that a player will win a game against an opponent, given that he is rated x points higher than his opponent.
Originally the chess system used a probit function based on the normal probability function. For ease of calculation, a logistic function has been used which matches the normal probability function quite well.
Using results of thousands of games in Australia, an analysis was made comparing the real win proportions with the probability predicted by the formula. It revealed that the curve used was not accurate. In particular it disadvantaged a player rated about 200 points higher than his opponent.
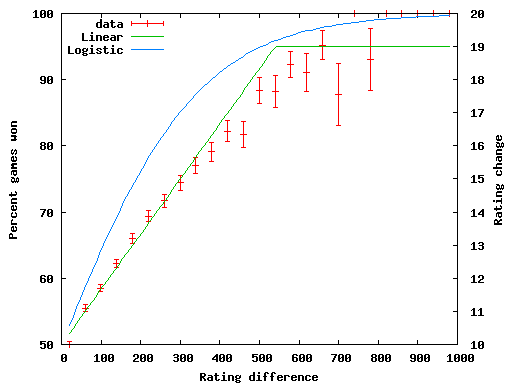
The data are from Australian tournaments for 2004 and 2005. The plotted points for the data are the percentage of games won by the higher rated player in a rating difference band. Each rating difference band is a range of 40 values. For instance the first rating difference band is from 0 to 39 (average taken as 19.5), the second is 40 to 79 (average taken as 59.5).
The bands for which there are fewer data have more uncertainty, indicated by the error bars which are a plus or minus amount reflecting 95 percent confidence limits. There are a lot of data for games with moderately small rating difference, and indeed it is these low values for which it is more important to model well.
| Diff | 19.5 | 59.5 | 99.5 | 139.5 | 179.5 | 219.5 | 259.5 | 299.5 | 339.5 | 379.5 |
| Act | 50.6 | 55.5 | 58.5 | 62.2 | 66 | 69.4 | 71.7 | 74.4 | 77 | 79.1 |
| Exp | 52.8 | 58.6 | 64.1 | 69.2 | 74 | 78.2 | 81.9 | 85.1 | 87.8 | 90.1 |
| Games | 11714 | 9640 | 7998 | 6054 | 4359 | 3127 | 2279 | 1604 | 1154 | 812 |
The blue curve is the logistic function used currently as a function of X the rating difference. The formula for the curve is =100/(1 + EXP(-X/172.0)). The value of 172.0 is a scale parameter.
The green line corresponds to the formula =50+ X/12 for X < 540, but is flattened out to 19 for values of X beyond that.
A straight line model has been suggested, which will better fit with the observed win proportions. If this linear model were adopted, ratings would change, so it is still unsure of how well it would fit after rerating all players over a period of time. We are preparing to do simulations, but a great deal of work needs to be done to clean up the messy data (misspelled names, players retired and revived etc)
You can experiment with the practical effect of the new model with this interactive calculator.